

|
Ouxiang Yu
IE 673 Live Nov 2nd, 2014 eLearning Pack ID: IE673-Fall-2014-63-39 Collaborative companies: Sunnen Nuvera SEW-EURODRIVE Automate 2015 |
This Assignment has been reworked according to the improvement recommendation of "improve the way you explain the analysis of the results" from Professor Ranky
Statement
I am Ouxiang Yu. I created this website and completed this assignment by myself.
Statement
I am Ouxiang Yu. I created this website and completed this assignment by myself.
Content
- Introduction and Objectives of the Project
- Brief Description of the Methodologies Applied
- Main Body of the Project:
- Defining Construction Control Charts
- Analyze the Charts
- Critical Process
- Out of Control Chart Analysis (Variables)
- Solution
- In Control Chart Analysis (Variables)
- Attributes Control Charts
- P-chart Analysis
- C-chart Analysis (Out of Control & In Control)
- Total Quality Improvement Solution Process
- Collaboration
- Social Networking
- Summary
- Further Work Needed
- References
- Self Grade
Introduction and Objectives of the Project
Green Ocean is going to detail out quality focus procedures. We will establish quality control, and quality principles. We will create a quality system. After that we will follow the national and international standards. we will develop Quality Control in terms of actions we must take in order to allow the product, equipment, software, service, to conform to pre-set standards and policy. We measure actual quality performance, compare it with standards by using Quality Control. Beside that, we will have Quality Assurance, which as defined as a system of activities with the mission to provide an assurance that the overall quality control is in fact being done effectively according to professor Paul. G Ranky. We will set up our Quality System that represents the collective plans, activities and events that are provided to ensure that a product, process, or service will satisfy given needs. In this way, we will be able to achieve the "Zero Defect".
We are a totally eco-friendly and sustainable and green. It helps our customers not only cut cost, rise benefits, increase efficiency, but also bring society benefits without any pollution. Auto Forklift and its system is a quality focused product. All products components will be outsource by each eco-friendly, sustainable and green, and total quality focused subcontractors.
In detail information, we also have a Total Quality Control Subsystems about purchase control, process control, manufacturing information control, operation control, process steps and process capability control, finished products control, measuring instruments and test equipment control, and corrective action control. Our quality system will follow ISO 9000:2000. We will focus on the key elements and areas of responsibilities of quality standards including Management Responsibility, Quality System, Contract Review, Design Control, Document Control, Purchasing, Purchaser Supplied Product, Product Identification and Traceability, Process Control, Inspection and Testing, Inspection, Measuring and Test Equipment, Inspection and Test Status, Control of Non-conforming Product, Corrective Action, Handling, Storage, Packing and Delivery of Materials, Quality Records, Internal Quality Audits, Training, Servicing, and, last but not the least, Statistical Techniques.
We use varies of methods, such as Deming's 14 Rules of Management and Quality Concepts, to achieve our organization to make profit for survival and provide the best service or goods at the lowest cost. everyone in our organization will contribute to improve our system. We will try our best to obtain The Malcolm Baldrige National Quality Award and be enrolled in the Baldrige National Quality Program. We will also performance TQM review. We will use Requirement Analysis Spreadsheet and Process-oriented failure Risk Analysis Spreadsheet.
We have Total Quality Control and follow Assurance Principles. We know 21 century is be knowledge driven century, so we will focus on this part. We focus on innovation as well. We will model Total Quality Systems and Processes with CIMpgr. We will also take into account of 18 monozukuri eco-principles. We will work on Green PLM (Product Lifecycle Management), including cross-functional design teams. We are going to develop a IT department and continuously improve the IT and IS. We focus on our design for green manufacture, assembly, disassembly, remanufacturing and recycling process. Employees training will be performed.
A brief description of the methodologies applied
Our company used the Control charts to play critical roles in the quality control process and in the procedures. It provides assurance of companies to manufacture high quality products. Statistical process control charts help us to set up mistake proof processes, develop upstream process controls, contribute to process and product redesign. As a result, it helps to monitor and keeps the processes under continuous control. The process of out-of-control condition should always be investigated. Then we should have corrective action, which is must. Manager must identify, control the sources of variation, take corrective action, and document these actions when the processes are not capable of being guided back to optimum control limits, which is the most challenging task in this area. Green Ocean utilizes variable charts and attribute charts, such as Xbar-chart, R-chart, p-chart and c-chart, to analyze problems in my company and develop the solutions to make sure that Green Ocean is manufacturing high quality green products.
Green Ocean have used the most popular method and model of Ranky's Integrated Sustainable iSEE, which is Green, or intelligent Sustainable Enterprise Engineering Model in the previous assignment. In Ranky's Integrated Sustainable iSEE, it believes that sustainable lean and greening process is a journey, not a destination. We know that it is different for our company to come up some common continuous improvement requirements and risk reduction solutions all the way. The process looks easy and simple, but actually it is very different. We have used professional object-oriented process modelling methods. They help and support our engineers and managers in their greening processes following international benchmarks and standards, which is critical to our Green and Sustainability, and Quality Focus.
To ensure that we will meet the needs and requirements of our customers, we will analyze requirements, determine their relative importance. We will also evaluate our system to meet them to make sure that our system is better than what other competitors provide. Component-Oriented Requirements Analysis (CORA) will be performed. We will use CORA to evaluate the correlation between the user requirements and available engineering solution. The next step we will subjectively evaluate how well we meet the most important requirements relative to our competitors. Last but not the least, we will evaluate the results and implement changes where necessary.
Defining Construction Control Charts
The Control charts to play critical roles in the quality control process and in the procedures. It provides assurance of companies to manufacture high quality products. Statistical process control charts help us to set up mistake proof processes, develop upstream process controls, contribute to process and product redesign. As a result, it helps to monitor and keeps the processes under continuous control. The process of out-of-control condition should always be investigated. Then we should have corrective action, which is must. Manager must identify, control the sources of variation, take corrective action, and document these actions when the processes are not capable of being guided back to optimum control limits, which is the most challenging task in this area. Green Ocean utilizes variable charts and attribute charts, such as Xbar-chart, R-chart, p-chart and c-chart, to analyze problems in my company and develop the solutions to make sure that Green Ocean is manufacturing high quality green products.
The construction of a control chart is typically performed in three main steps. We will have first step of Collection of Data. We determinate the quality characteristic of the product or process to study. After that we select m samples of n units for controls.Then each product or process the quality characteristic is measured and enter into the spreadsheet. Then we will have second step of Plot Data. We conduct plotting the collected data based on various mathematical formulas. Last but not the least, we have our third step of Computing Central Lines and Control Limits. Based on various mathematical formulas, we compute the central lines and control limits. Lines on these control charts (Central, Upper and Lower) can be used by users to decide whether the processes are stable or unstable. As changes are made, control limits must consider the variation in the processes and need to be calculated for the chart chosen.
Main Body of the project
Critical Process
The analyzed critical process will be the weight loading of our forklift. We will ensure the forklift works properly, and at same time, meets customer requirements. This forklift is assembled in our company. And the measured unit are all in pound (lbs). Quality control is the key to have a good quality product. We will receive calls from customers about complaints of our product, if anything goes wrong in the assembling of the Forklift. We will experience receiving returns, which cut our profits. As a result, Green Ocean and all subcontracts will begin to lose customers and profits. So it is why the weight loading of forklift is the important variable that must be controlled to maintain our products and customers.
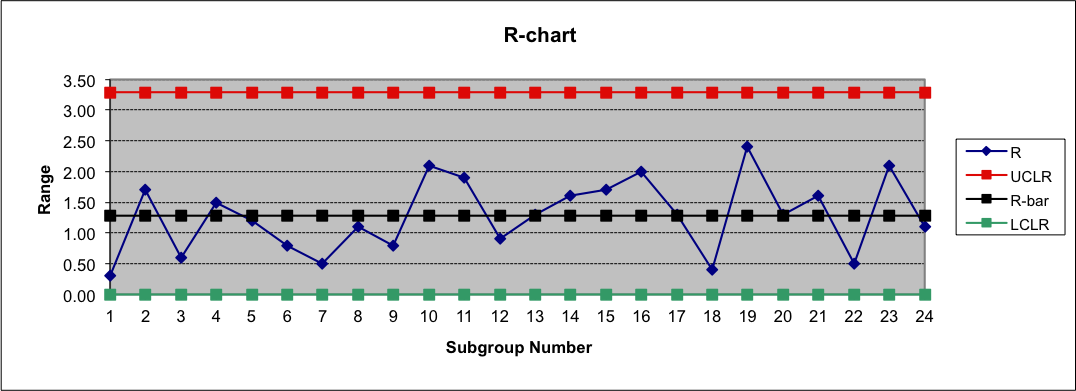
Out of Control Charts
We will focus on process A3.1, “Forklift Design” (can be found in Assignment 1). In the CORA spreadsheet of assignment 2, the engineer solution with the highest rating is “Hydrogen power.” The target value of Forklift was support for up to 30,000 lbs per forklift. We first collect data from two sets of tests. Then we plot and analyze the data to find out whether our processes are in control. The first set of tests will be for variables. We measure the tensile strength of the material used for forklift to see how well they conform to the specification of support for 4,000 lbs. We will collect samples for 24 days, with a sample size of three. Variation is acceptable as long as our process is in control, which means that variation will follow a normal distribution. The first plot below is the x-bar chart. It shows the average tensile strength over time. The second plot is the r-chart. It shows the changes in each day’s range over time.
Green Ocean is going to detail out quality focus procedures. We will establish quality control, and quality principles. We will create a quality system. After that we will follow the national and international standards. we will develop Quality Control in terms of actions we must take in order to allow the product, equipment, software, service, to conform to pre-set standards and policy. We measure actual quality performance, compare it with standards by using Quality Control. Beside that, we will have Quality Assurance, which as defined as a system of activities with the mission to provide an assurance that the overall quality control is in fact being done effectively according to professor Paul. G Ranky. We will set up our Quality System that represents the collective plans, activities and events that are provided to ensure that a product, process, or service will satisfy given needs. In this way, we will be able to achieve the "Zero Defect".
We are a totally eco-friendly and sustainable and green. It helps our customers not only cut cost, rise benefits, increase efficiency, but also bring society benefits without any pollution. Auto Forklift and its system is a quality focused product. All products components will be outsource by each eco-friendly, sustainable and green, and total quality focused subcontractors.
In detail information, we also have a Total Quality Control Subsystems about purchase control, process control, manufacturing information control, operation control, process steps and process capability control, finished products control, measuring instruments and test equipment control, and corrective action control. Our quality system will follow ISO 9000:2000. We will focus on the key elements and areas of responsibilities of quality standards including Management Responsibility, Quality System, Contract Review, Design Control, Document Control, Purchasing, Purchaser Supplied Product, Product Identification and Traceability, Process Control, Inspection and Testing, Inspection, Measuring and Test Equipment, Inspection and Test Status, Control of Non-conforming Product, Corrective Action, Handling, Storage, Packing and Delivery of Materials, Quality Records, Internal Quality Audits, Training, Servicing, and, last but not the least, Statistical Techniques.
We use varies of methods, such as Deming's 14 Rules of Management and Quality Concepts, to achieve our organization to make profit for survival and provide the best service or goods at the lowest cost. everyone in our organization will contribute to improve our system. We will try our best to obtain The Malcolm Baldrige National Quality Award and be enrolled in the Baldrige National Quality Program. We will also performance TQM review. We will use Requirement Analysis Spreadsheet and Process-oriented failure Risk Analysis Spreadsheet.
We have Total Quality Control and follow Assurance Principles. We know 21 century is be knowledge driven century, so we will focus on this part. We focus on innovation as well. We will model Total Quality Systems and Processes with CIMpgr. We will also take into account of 18 monozukuri eco-principles. We will work on Green PLM (Product Lifecycle Management), including cross-functional design teams. We are going to develop a IT department and continuously improve the IT and IS. We focus on our design for green manufacture, assembly, disassembly, remanufacturing and recycling process. Employees training will be performed.
A brief description of the methodologies applied
Our company used the Control charts to play critical roles in the quality control process and in the procedures. It provides assurance of companies to manufacture high quality products. Statistical process control charts help us to set up mistake proof processes, develop upstream process controls, contribute to process and product redesign. As a result, it helps to monitor and keeps the processes under continuous control. The process of out-of-control condition should always be investigated. Then we should have corrective action, which is must. Manager must identify, control the sources of variation, take corrective action, and document these actions when the processes are not capable of being guided back to optimum control limits, which is the most challenging task in this area. Green Ocean utilizes variable charts and attribute charts, such as Xbar-chart, R-chart, p-chart and c-chart, to analyze problems in my company and develop the solutions to make sure that Green Ocean is manufacturing high quality green products.
Green Ocean have used the most popular method and model of Ranky's Integrated Sustainable iSEE, which is Green, or intelligent Sustainable Enterprise Engineering Model in the previous assignment. In Ranky's Integrated Sustainable iSEE, it believes that sustainable lean and greening process is a journey, not a destination. We know that it is different for our company to come up some common continuous improvement requirements and risk reduction solutions all the way. The process looks easy and simple, but actually it is very different. We have used professional object-oriented process modelling methods. They help and support our engineers and managers in their greening processes following international benchmarks and standards, which is critical to our Green and Sustainability, and Quality Focus.
To ensure that we will meet the needs and requirements of our customers, we will analyze requirements, determine their relative importance. We will also evaluate our system to meet them to make sure that our system is better than what other competitors provide. Component-Oriented Requirements Analysis (CORA) will be performed. We will use CORA to evaluate the correlation between the user requirements and available engineering solution. The next step we will subjectively evaluate how well we meet the most important requirements relative to our competitors. Last but not the least, we will evaluate the results and implement changes where necessary.
Defining Construction Control Charts
The Control charts to play critical roles in the quality control process and in the procedures. It provides assurance of companies to manufacture high quality products. Statistical process control charts help us to set up mistake proof processes, develop upstream process controls, contribute to process and product redesign. As a result, it helps to monitor and keeps the processes under continuous control. The process of out-of-control condition should always be investigated. Then we should have corrective action, which is must. Manager must identify, control the sources of variation, take corrective action, and document these actions when the processes are not capable of being guided back to optimum control limits, which is the most challenging task in this area. Green Ocean utilizes variable charts and attribute charts, such as Xbar-chart, R-chart, p-chart and c-chart, to analyze problems in my company and develop the solutions to make sure that Green Ocean is manufacturing high quality green products.
The construction of a control chart is typically performed in three main steps. We will have first step of Collection of Data. We determinate the quality characteristic of the product or process to study. After that we select m samples of n units for controls.Then each product or process the quality characteristic is measured and enter into the spreadsheet. Then we will have second step of Plot Data. We conduct plotting the collected data based on various mathematical formulas. Last but not the least, we have our third step of Computing Central Lines and Control Limits. Based on various mathematical formulas, we compute the central lines and control limits. Lines on these control charts (Central, Upper and Lower) can be used by users to decide whether the processes are stable or unstable. As changes are made, control limits must consider the variation in the processes and need to be calculated for the chart chosen.
Main Body of the project
Critical Process
The analyzed critical process will be the weight loading of our forklift. We will ensure the forklift works properly, and at same time, meets customer requirements. This forklift is assembled in our company. And the measured unit are all in pound (lbs). Quality control is the key to have a good quality product. We will receive calls from customers about complaints of our product, if anything goes wrong in the assembling of the Forklift. We will experience receiving returns, which cut our profits. As a result, Green Ocean and all subcontracts will begin to lose customers and profits. So it is why the weight loading of forklift is the important variable that must be controlled to maintain our products and customers.
Out of Control Charts
We will focus on process A3.1, “Forklift Design” (can be found in Assignment 1). In the CORA spreadsheet of assignment 2, the engineer solution with the highest rating is “Hydrogen power.” The target value of Forklift was support for up to 30,000 lbs per forklift. We first collect data from two sets of tests. Then we plot and analyze the data to find out whether our processes are in control. The first set of tests will be for variables. We measure the tensile strength of the material used for forklift to see how well they conform to the specification of support for 4,000 lbs. We will collect samples for 24 days, with a sample size of three. Variation is acceptable as long as our process is in control, which means that variation will follow a normal distribution. The first plot below is the x-bar chart. It shows the average tensile strength over time. The second plot is the r-chart. It shows the changes in each day’s range over time.


Click here for the original excel document for the Charts above
Analysis
In the CORA spreadsheet of assignment 2, the engineer solution with the highest rating is “Hydrogen power.” The target value of Forklift was support for up to 30,000 lbs per forklift. We first collect data from two sets of tests. Then we plot and analyze the data to find out whether our processes are in control. The first set of tests will be for variables. We measure the tensile strength of the material used for forklift to see how well they conform to the specification of support for 4,000 lbs. We will collect samples for 24 days, with a sample size of three. Variation is acceptable as long as our process is in control, which means that variation will follow a normal distribution. The first plot below is the x-bar chart. It shows the average tensile strength over time. The second plot is the r-chart. It shows the changes in each day’s range over time.
We need to determine variations if they are any. We measured the batches of products using process control charts for variables where the inputs the data were the tensile strength. These Hydrogen power were randomly sampled. The statistical tool applied to detect the out-of-control process was the Control Charts for Variables from the new 'Ranky-Stat_Library' folder in this 3D eBook. We will create the X-bar and R chart by taking measurements of the length values five batches per day during a period of 25 days.
In analyzing the plots and charts, analysis will always start with the R- chart and X-bar chart. From the analysis and observation, it was seen that a couples of the samples was beyond the control limits. This is reflected in the chart at the 5th, 9th and 17th plot. This illustrates that the process is out of control. Therefore, we need to fix the process.
With these two charts above, we know that our process in out of control. In x bar-chart, we find out that the average tensile strength on day 16, which is 6,170 lbs, is above our upper control limit, which is 5,550 lbs. Moreover, The r-chart tells us that the range of measurements on day 8, which is 5,400 lbs, is also above our upper control limit, which is 3,420 lbs. Both of them indicate that the process is out of control.
Solution
To determine the corrective actions is the most difficult and important part. We decide to work primarily in collaboration with Sunnen, who helped us develop the material used for the forklift. We have to improve the uniformity of the strength of the textiles used. For the same measured data after improvements were made can be seen below. After that, our process is in control.
In Control Charts

Click here for the original excel document of the Charts above
Attributes Control Charts
P - Chart is a control chart for the percentage of non-conformance. C - Chart is a control chart for the number of defects or nonconformities. U - Chart is a control chart for the number of nonconformities per unit.
P-Chart Out of Control
The second set of tests will be for attributes. We measure the tensile strength of the support steel at the random position of each forklift's lift to find out how well they meet the specifications. We test in order to see whether samples can support 360 lbs (120% of the specification). If the sampled steel cannot support the load, it will be assessed as nonconforming. The data from the first set collected is displayed in the p-chart below.

Click here for original excel document of the Chart above
Analysis
In the CORA spreadsheet of assignment 2, the engineer solution with the highest rating is “Hydrogen power.” The target value of Forklift was support for up to 30,000 lbs per forklift. We first collect data from two sets of tests. Then we plot and analyze the data to find out whether our processes are in control. The first set of tests will be for variables. We measure the tensile strength of the material used for forklift to see how well they conform to the specification of support for 4,000 lbs. We will collect samples for 24 days, with a sample size of three. Variation is acceptable as long as our process is in control, which means that variation will follow a normal distribution. The first plot below is the x-bar chart. It shows the average tensile strength over time. The second plot is the r-chart. It shows the changes in each day’s range over time.
We need to determine variations if they are any. We measured the batches of products using process control charts for variables where the inputs the data were the tensile strength. These Hydrogen power were randomly sampled. The statistical tool applied to detect the out-of-control process was the Control Charts for Variables from the new 'Ranky-Stat_Library' folder in this 3D eBook. We will create the X-bar and R chart by taking measurements of the length values five batches per day during a period of 25 days.
In analyzing the plots and charts, analysis will always start with the R- chart and X-bar chart. From the analysis and observation, it was seen that a couples of the samples was beyond the control limits. This is reflected in the chart at the 5th, 9th and 17th plot. This illustrates that the process is out of control. Therefore, we need to fix the process.
The observed data was transformed to the chart. As we can see from the new chart there is no point outside the control limit in the R-chart and there is no other reason to say the chart is out of control. Therefore, we can then proceed to analyze the X-bar chart. Looking at the X-bar chart, first there are no points outside the control limits and secondly there is no trend anomaly that is 7 consecutive points above or below the central line.
We calculated the average voltage, Upper Control Limit (UCL) and Lower Control Limit (LCL) of the samples. After plotting the mean data of the samples we noticed that each data point was within the LCL and UCL, this demonstrates that after inspection and calibration of printing machines, our process is now in control.
With this control chart, we know that the process is again out of control. Now the process will need to be fixed and a new set of data will need to be collected. Failure to control this process would result in unnecessary waste as we reject nonconforming steel, or worse yet ship defective items to customers.
Solution
We would collaborate with engineers from Sunnen to improve our process until we collect data that shows our process in control. The plot for below shows the p-chart once the process is back in control.
P-Chart In Control

Click here for original excel document of the Chart above
C-Chart Out of Control
The C-chart is a control chart for the number of defects or non-conformities. Green Ocean company uses C-chart to detect defective product in order to ensure that customer will not use any forklift that is defective. By doing so, we will be able to ensure the total customer satisfaction. In analysis part, we will check for the performance of forklift's lift.
The C-chart is a control chart for the number of defects or non-conformities. Green Ocean company uses C-chart to detect defective product in order to ensure that customer will not use any forklift that is defective. By doing so, we will be able to ensure the total customer satisfaction. In analysis part, we will check for the performance of forklift's lift.

Click here for the original excel document for the chart above
Analysis
In the CORA spreadsheet of assignment 2, the engineer solution with the highest rating is “Hydrogen power.” The target value of Forklift was support for up to 30,000 lbs per forklift. We first collect data from two sets of tests. Then we plot and analyze the data to find out whether our processes are in control. The first set of tests will be for variables. We measure the tensile strength of the material used for forklift to see how well they conform to the specification of support for 4,000 lbs. We will collect samples for 24 days, with a sample size of three. Variation is acceptable as long as our process is in control, which means that variation will follow a normal distribution. The first plot below is the x-bar chart. It shows the average tensile strength over time. The second plot is the r-chart. It shows the changes in each day’s range over time.
We need to determine variations if they are any. We measured the batches of products using process control charts for variables where the inputs the data were the tensile strength. These Hydrogen power were randomly sampled. The statistical tool applied to detect the out-of-control process was the Control Charts for Variables from the new 'Ranky-Stat_Library' folder in this 3D eBook. We will create the X-bar and R chart by taking measurements of the length values five batches per day during a period of 25 days.
In analyzing the plots and charts, analysis will always start with the R- chart and X-bar chart. From the analysis and observation, it was seen that a couples of the samples was beyond the control limits. This is reflected in the chart at the 5th, 9th and 17th plot. This illustrates that the process is out of control. Therefore, we need to fix the process.
We analysis the possible failure by using c-chart. The failure of efficiency will influence in the reliability of our auto Forklift functionality. This is a very important test since we are able to measure the real reliability of the forklift. Sunnen will offer us the right material to guarantee a great quality product. The sample size of the C-Chart is 220, and sample number is 25. The UCL average is 19.07, LCL is 0.37 and c-bar is 9.72. The 7th and 17th data points were outside the UCL, which means that our process of producing non-conforming units is out of our tolerance. The result tells that our process was out of control. Now we will try bring this process in control.
Solution:
We checked the 7th and 17th production and work with Sunnen with the problem to fix it. After we discussed and found out the material was in bad quality which cause this problem. We pull out the good quality production and replace the material and re-product the the product. After that, we texted again and put those number into 7th and 17th day. We initiated the Corrective Action Plan to find out what caused the variation. Our team of experts has analyzed the problem and come up with specific reasons. The efficiency of the material caused fluctuations toward the end of the process. This will help avoiding such variations in the process in the future. After fixing the problems, we see that the process is in control.
C-Chart In Control

Click here for original document of the chart above
Total Quality Improvement Solution Process
Continuously improving our product and system is our goal and task. We will have further work on international greening approaches and solutions, sustainable green product design standards, sustainable green manufacturing standards, customer requirements analysis, product and process and service system risks, product reuse and green remanufacturing and recycling and reuse, global green supply chains, and keep studying from those international use-cases.
Collaboration
We used the Control charts to play critical roles in the quality control process and in the procedures. It provides assurance of companies to manufacture high quality products. Statistical process control charts help us to set up mistake proof processes, develop upstream process controls, contribute to process and product redesign. As a result, it helps to monitor and keeps the processes under continuous control. The process of out-of-control condition should always be investigated. Then we should have corrective action, which is must. Then we will have further work with Sunnen, Nuvera, Auto 2015.
All products components will be outsource by each eco-friendly, sustainable and green, and total quality focused subcontractors, such as SEW Company, who will be the provider of all customized drive components, Nuvera Company, who provides the best eco-friendly Hydrogen fuel cell, Sunnen Company, who meet our specialized sustainable and green honing and rilling requirements, and Automate 2015, who is not only the critical information of green and sustainable focused and total quality focused subcontractors provider, but also the organization for us to promote our quality and green focused product within a sustainable and green and quality focused manner. CORA, and the related methods discussed, will help us focus our team on quality. First and foremost, it keeps the focus on the customers and what they need. It involves all people on the team. It is not just done once and then set aside, but rather should be iterative to foster continual improvement. It helps us make decisions based on facts, data, and analysis. Finally, it shows us how our collaboration can mutually benefit our suppliers and us.
Based on what we have analyzed here, we are confident in our choice to collaborate with SpeedCell to develop lightweight textile shelves for our mobile application. We will work with Sunnen to design the system to control the movement of the shelves in the delivery trucks. Nuvera will provide the Hydrogen power needed to run the system, and based on this analysis will help us develop a greener charging system. Our design will be introduced to potential buyers at Automate 2015 in March. to design the system to control the movement of the Auto Forklift
Summary
We used the Control charts to play critical roles in the quality control process and in the procedures. It provides assurance of companies to manufacture high quality products. Statistical process control charts help us to set up mistake proof processes, develop upstream process controls, contribute to process and product redesign. As a result, it helps to monitor and keeps the processes under continuous control. The process of out-of-control condition should always be investigated. Then we should have corrective action, which is must.
Manager must identify, control the sources of variation, take corrective action, and document these actions when the processes are not capable of being guided back to optimum control limits, which is the most challenging task in this area. Green Ocean utilizes variable charts and attribute charts, such as Xbar-chart, R-chart, p-chart and c-chart, to analyze problems in my company and develop the solutions to make sure that Green Ocean is manufacturing high quality green products.
We used Deming's 14 Rules of Management and Quality Concepts to achieve our organization to make profit for survival and provide the best service or goods at the lowest cost. We have learned more about how to provide a quality product to our customers. We will try our best to obtain The Malcolm Baldrige National Quality Award and the Baldrige National Quality Program.
We saw where we were providing a better product than our competitors, and more importantly where we can continue to improve. everyone in our organization will contribute to improve our system. We will also performance TQM review. We will use Requirement Analysis Spreadsheet and Process-oriented failure Risk Analysis Spreadsheet. We will have Total Quality Control and follow Assurance Principles. We know 21 century is be knowledge driven century, so we will focus on this part. We will focus on innovation as well. We will model Total Quality Systems and Processes with CIMpgr.
Further Work Needed
Continuously improving our product and system is our goal and task. We will have further work on international greening approaches and solutions, sustainable green product design standards, sustainable green manufacturing standards, customer requirements analysis, product and process and service system risks, product reuse and green remanufacturing and recycling and reuse, global green supply chains, and keep studying from those international use-cases.There are constantly different ways in which we can improve the quality of our products and service. We have to keep in mind that we are never always at the highest level of quality, since there will always be aspects that will be needed to improve. Further work will include continuously improvement. This will allow us to cut costs and be quality focus, sustainable and green. We will try our best to keep working on making our processes more eco friendly, lean and sustainable.
References
Prof. Paul Ranky, “IE673 Total Quality Management eLearning Pack”, Fall 2013.
Sunnen - http://www.sunnen.com/
Nuvera - http://www.nuvera.com/
SEW-EURODRIVE - http://www.seweurodrive.com/
Automate 2015 - http://www.automateshow.com/index.cfm
Social Networking
Article 1 <Beijing Supports Tianjin's Logistics Hub Role>
This article is about how Tianjin, Hebei and Beijing, the capital city in China, coordinate with each other. There is a trend that more and more cities in China gather together and combine with each other to further grow. Tianjin and Hebei will be developed as an open, single market for commerce and circulation. Beijing encourages foreign trades. And encourage them to set up logistics warehouses and commodity distribution centers in Tianjin zone.
The trend that cities are going to working together and complement each other has been existed for a while. Such as Guangzhou and Hong Kong. In Shanghai, big districts, such as Chongming and Fengxian, becomes important strategic area of Shanghai’s economy. And new cities, Jiading, became part of Shanghai. Chinese know that it is time for them to catch up with the world.
I agree with Yidi that with the development of Bejing, cities around it started to become complement to Beijing and to be further developed.
"As the capital city of China as well as the most developed area, Beijing has been developing dramatically rapid in the past few decades. Rather saying the support that Beijing is providing to Tianjin, I would say the driving effect that Beijing is potentially affecting on the surrounding cities and areas including Tianjin and Hebei in this case. There are a lot of logistic hubs and wholesaling centers in China and it is kind of late that the one in Tianjin was just planned to set up. However, the unique aspect is the integration of the production and marketing of agricultural products, not only the cooperation with Tianjin, but also deepen with major producing areas in Hebei. In my perspective of view, this is the real "GREEN" aspect of the the support and cooperation, not only because of the non-pollution cooperation, but also the green sustainability of human health, which is somehow more important than wholesaling trade. - By Yidi Wang"
"In this article, Beijing, Tianjin and Hebei will develop into an open, single market for commerce and circulation, promoting where the mutual expansion of retailing within the three places. The Beijing department of Commerce will encourage foreign trade forwarding, logistics and cross-border e-commerce enterprises to set up logistics warehouses and commodity distribution centres in Tianjin’s special customs supervision zones. I agree with Yidi’s opinion that in recent years Beijing develops rapidly, and the most important thing is that Beijing is affecting on the surrounding cities, like Hong Kong, which has a profound effect on the surrounding cities, such as Shenzhen, Guangzhou after homecoming of Hong Kong. Another important thing which we can know from this article is that the Chinese government and enterprises are trying to seek method and improve themselves to keep up with the world. The good example and the recent hottest topics is Alibaba Group. - By Jia Wang"
Article 2 <Food Facilities Required to Re-Register with FDA by Year's End>
This article is about that FDA enforced regulation that runs the food industry safety and healthy. FDA is continually improving its regulations of the food industry in order to protect people’s health.
Chinese used to think food in USA is healthier than that in China. I am among them. With more and more people in China becoming rich and connection with outside world, Chinese become more and more serious to the healthy issue in China. Things are changing. I hope in the future I will change my opinion of the food industry in China.
I agree with both Jia Wang and Yidi Wang that it is the time for China government to concern about the regulations and product quality of food industry now.
"It is the very enforcing regulation promulgated by FDA that runs the food industry safe and healthy. As contrast, this reminds me of the food concerns in Mainland China, which has been a huge issue and still is. One event was the top representational company in milk industry which resulted in infants death after drinking its product; other events including genovariation chicken in restaurants such as KFC and McDonald; there are also a lot of news reported revealing the expired or in-eatable food processed in famous restaurants in China. The very severe food health situation in China needs more restricted statutory laws and regulations, not like the federal oversight in the U.S., Chinese government seems pushing themselves in the front but still need more time. Fortunately we see improvement and we are at least confident. - By Yidi Wang"
"When I was in China, most of my friends liked American products and believed that American products are perfect, especially for American food and drugs. We can see from this article that FDA is constantly improving regulations to preserve the population’s health. Not only FDA, but also USP (U.S. Pharmacopeia) and other organizations and food/Pharmaceutical companies are improving themselves constantly. They deserve Chinese government and enterprises learning most. It’s comforting to know that more and more Chinese food/pharmaceutical companies submit their registrations to FDA and these companies not only want to develop market, but also want to improve their product quality. - By Jia Wang"
Article 3 <China Further Cuts Investment Approval Items>
This article is about that China Government policy of foreign investment. On the one side, China wanted to attract foreign investment. On the other side, it wants to protect China economy. Policy indicates that liberalization and administration should have equal importance role.
In my opinion, China government could open the resource and door for sustainable green and ecofriendly investments. This is going to provide a long-term positive effect on China future development.
I agree with Yidi Wang that scraping approval requirements, especially for chemical industry, my have potential risk on pollution.
"I wouldn't say this is a bad decision nor a good one. From different point of view, conclusions may come to be different. From the perspective of triggering and promoting economic growth, this is somehow a good news for those who can't wait to invest. However, from the perspective of market health and Green Sustainability, the investment items that are exempt from approval may have potential concerns such as pollution or health issue. Not until the last sentence of the essay that I found what I've been looking for, which is the strengthening of supervision and equal importance of administration. However, the essay did not tell us who is doing the supervision and how is the administration improved to assure health and green sustainable aspects. - By Yidi Wang"
"From this article we can know that the Chinese Government firmly adheres to the opening-up strategy featuring mutual benefit and the policy of welcoming and attracting foreign investment. I agree with the equal importance of liberalization and administration, however, like Yidi’s opinion, scraping approval requirements may have potential risk on pollution or health issue, especially scraping approval requirements for chemical industries. We all know that China is facing immense environmental problems. It is essential to strengthen ongoing supervision, and it needs that the Chinese government constantly adjust relevant policies and law, such as environmental law, to protect the market health and Green Sustainability. - By Jia Wang"
Resource: http://njit2.mrooms.net/mod/forum/discuss.php?d=42453#p137429
Self Grade
I will grade absolutely myself with an A+. I followed exactly from the syllabus and checked each task. I made sure that I have everything included. So I think I deserve A+. Besides I love quality focus concept. I want to improve China better place for living like what professor said. I read syllabus ahead of time and again and started assignment 3 early. I followed what is required in the syllabus and instruction of assignment 2 in the syllabus. I created the assignment 3 checklist. I read through the 3D text book chapters. I communicated with many classmates, such as Yidi Wang, Jia Wang, about the articles. I pushed myself a lot on the thoughts regarding about the articles. I did more researches. I have been coming to class sitting in front of the class since the first class. I made a beautiful website. I worked hard. I love sustainable and green concept. For all those facts above, I will grade myself obviously A+.
Thank you again for your leading and latest methods, your useful indeed templates, and assignments. I agree with you and like them.
